


On January 1 of this year, Ontario became Canada’s second province to mandate a
significant increase in minimum wage in recent years.
Many experts have commented on how restaurants need to react to deal with this increase. The thinking is operators will have to increase prices, shorten or eliminate shifts and/or positions, reduce operating hours and look to technology for productivity gains. What’s been surprisingly absent in any discussion is how the elimination of tipping could play a role in helping restaurants maintain past Earnings Before Interest, Taxes, Depreciation and Amortization (EBITDA) results.
I argue that within a tipping system, this loss of revenue control becomes increasingly significant when governments step in to regulate an increase in minimum wages.
I also posit that full-service restaurants should consider the elimination of tipping as a strategy to try to maintain desired levels of EBITDA.
What does it look like?
In this article, I’ll show restaurants can maintain (or at least be closer to) pre-minimum-wage-increase levels of EBITDA by eliminating tipping and taking a 15-per-cent price increase (average tip percentage) without any reduction in staffing levels or other cost-cutting methods. This change could help maintain the profitability expectations of operators and ensure current quality standards of food and service across the industry. It should be noted that in this scenario, the current cost of a restaurant experience would not increase for a customer as the ‘tip’ has been replaced by the cost of the menu item that is now under full control of the operator. This method of pricing is referred to as ‘price inclusive’ and has been introduced in several restaurants across North America, including seven of Danny Meyer’s restaurants in New York City.
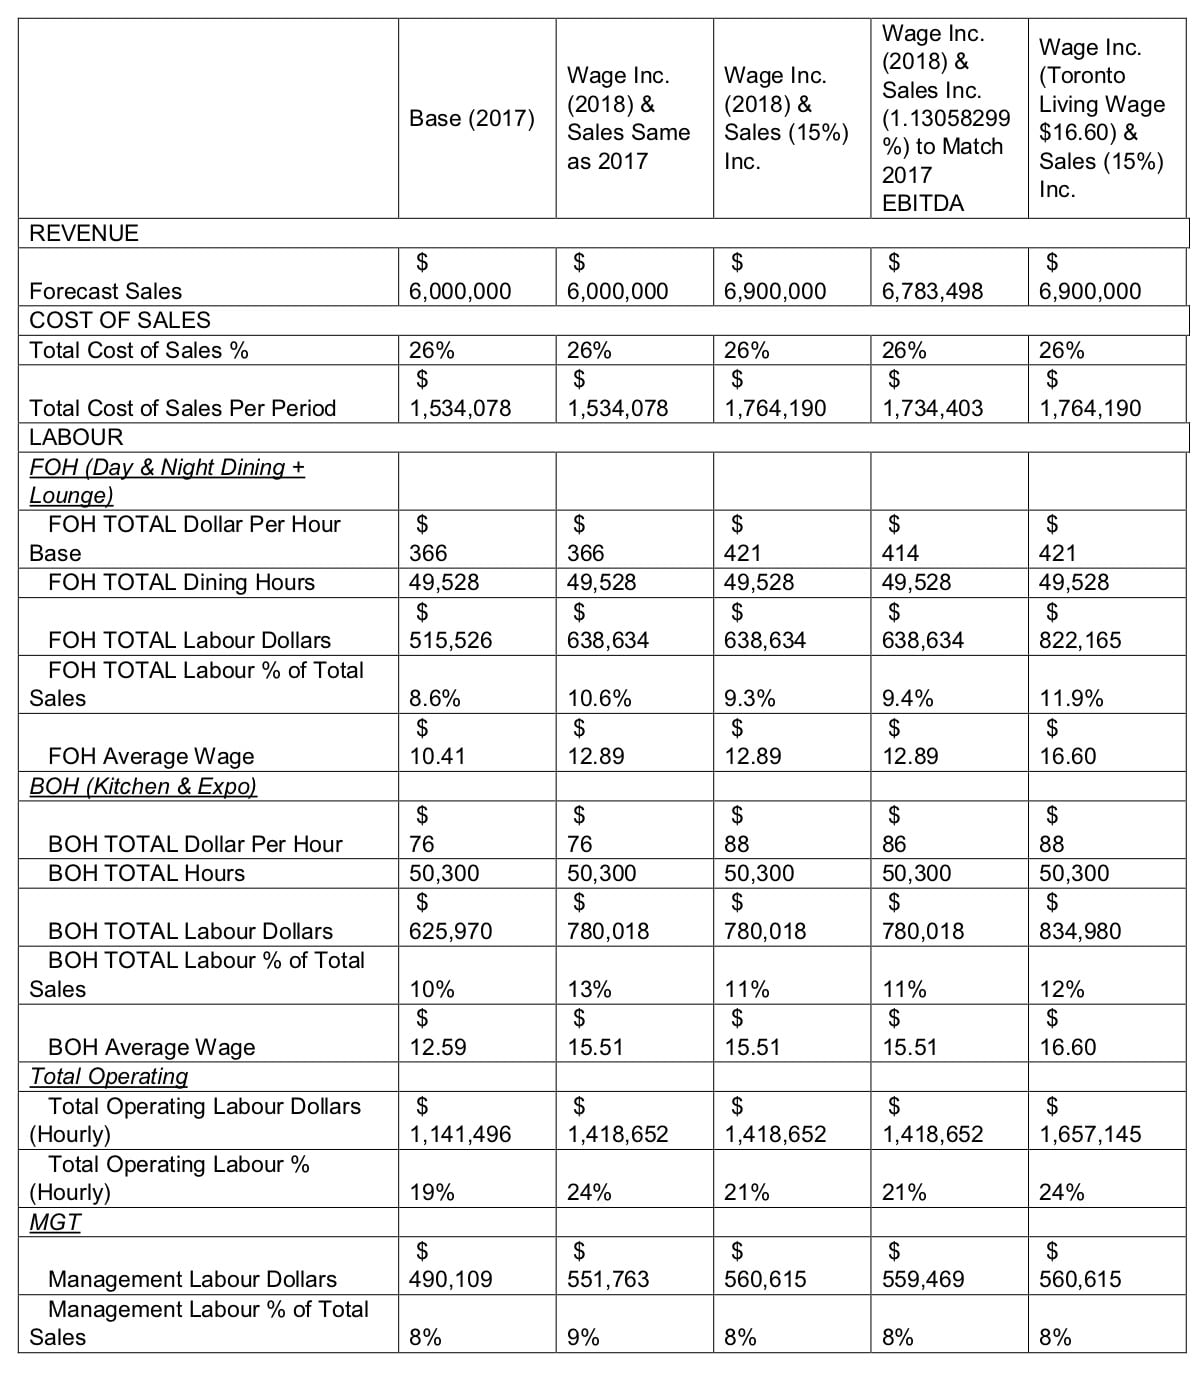
To illustrate this idea, I’ve used the actual 2017 and projected 2018 income statement from a full-service restaurant located in the greater Toronto area. I’ve rounded down the sales of the restaurant to $6 million a year for ease in comparison. All labour percentages, average-wage rates and number of labour hours represent actual results in 2017 (pre-minimum-wage increase). Projections for 2018 (post-minimum-wage increase) are actual figures used in the restaurant’s budgeting process. I’ve also set the controllable and marketing costs as fixed percentage-based costs. Fixed/occupancy costs were set as fixed across the board.
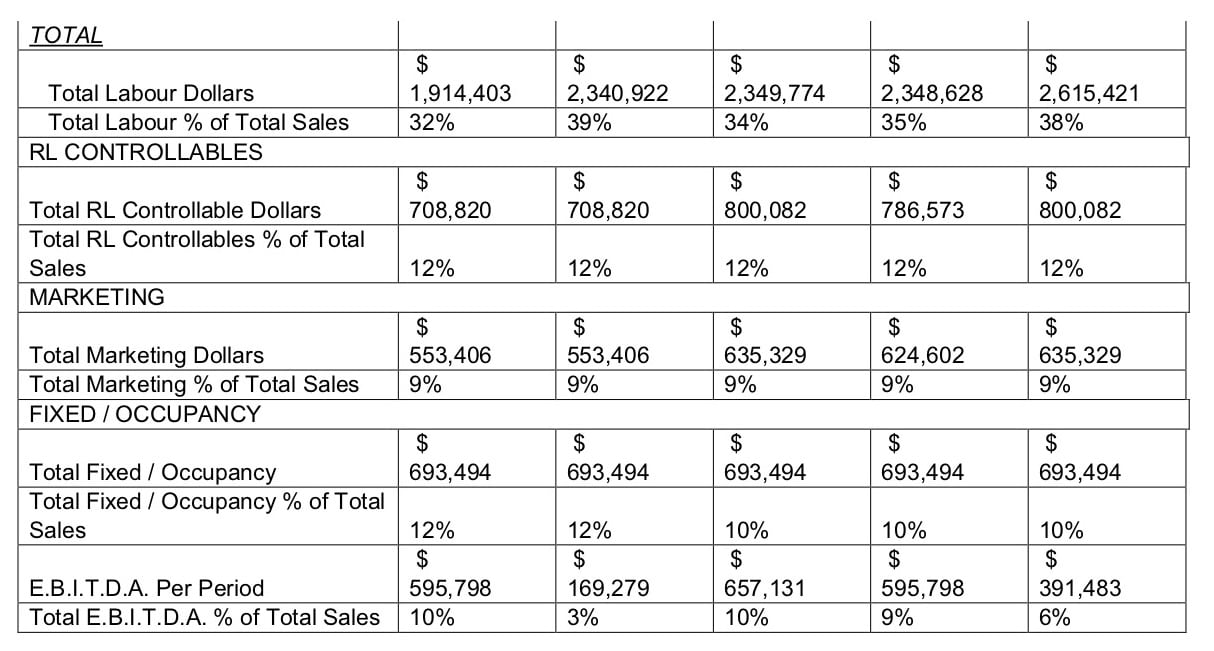
In the chart (below), I’ve provided five variances of the restaurant’s yearly Income Statement (IS). Column one shows actual results for 2017. Column two shows what a projected IS for 2018 would look like with sales equivalent to 2017 but with new minimum-wage levels in place. These numbers represent the actual budget for 2018 for this restaurant. Notice the drop in EBITDA of $426,500 or seven per cent. Column three shows an IS for 2018 with a 15-per-cent price increase (tipping eliminated) with new minimum-wage levels. In this instance there is an increase in EBITDA of $61,000 remaining at 10 per cent. In column four I manipulated the sales to see what per cent price increase would be needed to only maintain 2017 EBITDA, while still adjusting for new-wage rates. To do this, I had to increase sales (pricing) 13.1 per cent. In column five, I’m interested in seeing what the EBITDA would be if sales were raised 15 per cent and all restaurant employees were paid what is considered a living wage in Toronto ($16.60). The result of this was a drop of EBITDA of approximately $204,000 or per cent. These examples illustrate varying approaches companies may use to change the compensation model in their restaurants while maintaining 2017 levels of EBITDA, or at least closer then the projected 2018 numbers.
Beyond the sales and EBITDA changes, the biggest consideration to be understood in these income statements is the average wage rates I set. It’s important to notice in the chart I’ve included the average server and BOH wages for this restaurant in each example. The key comparison to make is between columns two and five. Column two shows the new reality — front-of-house wage is $12.89, back-of-house wage is $15.51 and EBITDA drops to $169,279. In column five I’ve increased pricing by 15 per cent, paid a living wage in which all employees in the restaurant are making $16.60 an hour and still make significantly more EBITDA at $391,483. In fact, if both FOH and BOH were raised to $18, it would still make more EBIDTA ($235,812). I recommend a move closer to $18 for all restaurant employees, which would still see an increase of $66,533. It should be noted when Meyer moved to the inclusive-price model, he increased his menu pricing between 20 and 25 per cent.
Not lost in this thinking is the understanding that such a shift in the restaurant-compensation model would be a zero-sum game for current servers in the industry. Given this assumption, it’s important to take into consideration an important number. In my example, the restaurant posts sales of $6 million a year. Given that I estimate the average tip in Ontario to be 15 per cent, there would be approximately $900,000 worth of tips collected by servers at this restaurant. This restaurant has a tip-sharing system in which they give five per cent back to the house to be distributed to support staff. If you calculate the net dollar value of tips for servers, you end up with $600,000. In 2017, this restaurant used approximately 40,528 server hours, which shows that on average, servers are making $14.80 per hour in gratuities after tipping out. This number is relatively close the findings in the2016 study.
This model would see an increase in their ability to pay managers and back-of-house employees more, while maintaining the pre-2018 minimum-wage increase levels of EBITDA. Servers in this new model would make considerably less money — closer to the wages paid to back-of-house employees. By letting the market dictate, you’ll see operators set wages based on supply and demand, while enabling them to pay employees based on performance, something that is not necessarily the case in our current system.
What would change?
A decrease in overall server wages would inevitably change the landscape of the server labour pool. Previous research showed there exists a significant portion of servers in Ontario we refer to as ‘mercenary’. These servers are only interested in serving for a short period of time to make ‘quick cash,’ often to pay off student loans or support themselves while waiting for a ‘real job’ to come along. This young, highly educated, but transient group show little commitment to the industry and hence we’ve seen the role of server in restaurants become something looked upon in this country as temporary work. This North-American phenomenon is detrimental to the overall health of the full-service restaurant industry. Whereas in other parts of the world being a ‘server’ is considered a profession, in North America it’s often not seen as a viable and respected career option.
The goal
Is the idea of eliminating tipping the answer to our industry’s problems of ever shrinking margins? This could be the case but, more importantly, what I’ve shown in this article is there’s room for discussion regarding the wages we pay employees. By putting the idea of a new model forward, I hope to not only create discussion but also dialogue. The buzz in business circles is that disruption is not only beneficial, but essential for businesses to succeed. Perhaps it’s time to embrace the minimum-wage increase? Not because we’re now paying closer to a living wage, but because it could ultimately be the disruption the industry is so in need of.
by Mark Holmes and Bruce McAdams.